Are you wanted to calculate Concentration from Absorbance in Excel, but don’t know how to calculate it, then don’t worry, here we share some easy ways to calculate concentration from absorbance in excel
Spectrophotometry is an analytical method that has many applications in the fields of chemistry, biology, and other sciences. The method is useful for determining the concentration of a material in solution by measuring the amount of light absorbed by a sample at a predetermined wavelength.
Absorbance (or A) is a crucial spectrophotometric measure since it correlates linearly with analyte concentration. The absorbance readings of a solution can be used in conjunction with this relationship to derive its concentration.
Excel is widely used in the scientific world for data analysis and visualization, and in this post we’ll look at how to use this powerful program to determine concentration from absorbance.
How to Calculate Concentration from Absorbance and Wavelength in Excel:
The Beer-Lambert Law must be grasped before delving into the technicalities of converting absorbance to concentration. According to Beer-Lambert’s law, the absorbance of a solution depends linearly on the concentration of the analyte and the path length of the sample cell and inversely on the molar absorptivity (molar absorptivity, ) of the material at the chosen wavelength.
The Beer-Lambert Law can be stated as a formula as follows:
A = ε * c * lMolar absorptivity (or molar absorption coefficient or molar extinction coefficient) = A * (Absorbance) * (Molar absorption coefficient or molar extinction coefficient). Cell path length (l) = Analyte concentration (c)
Since ε and l tend to be constants, the relationship between absorbance and concentration is straightforward:
A = ε * cConcentration can be determined from absorbance by rearranging the following equation to obtain c:
c = A / εLet’s move on to how to do this computation in Microsoft Excel.
Read More : 3 Easy Ways To Add Dashes To SSNs In Excel
How Do You Find Concentration from Absorbance?
1. Data Collection: gather your experimental data, which should include the absorbance values (A) of your samples at a particular wavelength. For the same wavelength, you’ll also need to know the molar absorptivity () of your analyte. You can get this number from the manual for your instrument or from published sources.
2. Set Up an Excel Spreadsheet: Open Microsoft Excel and create a new blank spreadsheet. Your absorbance readings should go in one column, and your analyte’s molar absorptivity () should go in another.
3. Calculate Concentration: by plugging values from columns 2 and 1 into a concentration formula and writing the result in a third column. For an empty cell, A1, which has the absorbance value, and B1, which contains the molar absorptivity value, use the following formula:
=A1 / B14. Use the Formula: To determine the concentrations of all the samples, copy the formula along the column.
5. Label and Format: Label your columns clearly (for example, “Absorbance,” “Molar Absorptivity,” and “Concentration”), and arrange your spreadsheet so that everything is easy to understand.
How to Plot a Graph of Absorbance vs. Concentration in Excel:
In order to see how absorbance and concentration are related, a graph of the two must be made. Such a graph can be quickly and easily made in Excel. Here’s how to accomplish that goal:
- Choose Data: Mark the Columns Containing Your Absorbance and Concentration Information.
- Insert Chart: To insert a chart in Excel, select the “Insert” tab and then the desired chart type. Data involving absorbance and concentration works well as a scatter plot.
- Customize the Chart: Add names and labels to the axes and change the look of the data points to create a chart that best suits your needs. Make sure the y-axis shows absorbance and the x-axis shows concentration.
- Trendline: a trendline might be added to show the linear relationship between absorbance and concentration. You can use a linear regression model by right-clicking a data point, selecting “Add Trendline,” and making your selection from the drop-down menu that appears. The linearity of your data can be assessed with the help of this trendline.
- Equation and R-squared Value: Graph the equation of the trendline, which shows the relationship between absorbance and concentration, and show the R-squared value. The R-squared statistic, which indicates how well your data fits the linear model, is also available in Excel.
How to Calculate Concentration from Absorbance Standard Curve:
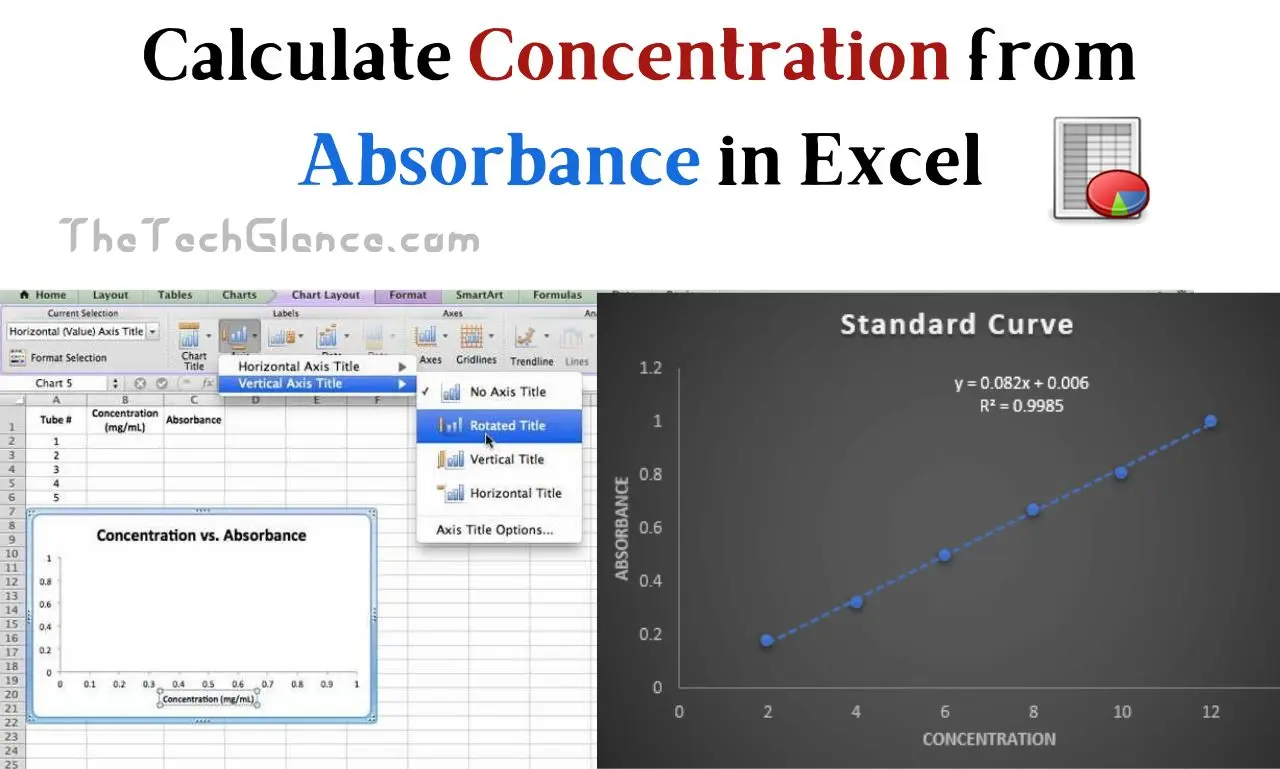
In analytical chemistry, a standard curve is often constructed. The absorbance of a series of standard solutions with a known concentration of the analyte is measured. The absorbance values and concentrations of the standard solutions can be plotted on a graph to create a standard curve. An unknown sample’s concentration can be determined by interpolating its absorbance against the standard curve.
Here’s How to Construct a Standard Curve and Apply It to Determine an Unknown Sample’s Concentration
- Prepare Standard Solutions: establish a set of standard solutions whose analyte concentrations are known. It is crucial that the concentrations of these solutions cover a wide spectrum.
- Measure Absorbance: Take absorbance readings at the same wavelength as your unknown sample for each of your standard solutions. Get out your Excel spreadsheet and jot down these numbers.
- Plot the Standard Curve: Create a scatter plot in Excel with concentration along the x-axis and absorbance along the y-axis to draw the standard curve. The standard curve should be represented by this graph.
- Add a Trendline: To get the equation of the line, simply add a trendline to your standard curve, as was previously instructed.
- Calculate Concentration of Unknown Sample: Determine the unknown sample’s concentration by measuring its absorbance at the same wavelength as the standards. Determine the concentration of the unmeasured sample by solving for the equation derived from the trendline.
How Do You Show Concentration in Excel?
The following steps will show you how to display the calculated concentration in Excel:
- Insert a Column: Create a New Column in Excel Next to the Column Where Concentrations Were Calculated.
- Label the Column: Type a suitable heading for the new column, such as “Concentration (mg/mL).”
- Copy Calculated Concentrations: paste the computed concentrations from the column where they were calculated into the new column you just made.
- Formatting: choose your preferred decimal places, units, and other formatting options for the concentration column.
- Final Review: Double-check the concentration numbers provided in your spreadsheet before moving on.
Read More : 7 Shocking Disadvantages Of A Smart Home
Conclusion
Researchers and scientists in a wide variety of fields need to be able to use Excel to derive concentration from absorbance. The concentration of a solution can be calculated from its absorbance values by applying the Beer-Lambert Law and following the procedures detailed in this article. Excel also provides a useful tool for quantitative analysis by allowing users to make standard curves and show data using graphs.
Concentration calculations may be made much easier with Excel’s built-in functions for data management, visualization, and analysis. Excel is a useful tool for analyzing experimental data due to its built-in mathematical functions, trendlines, and graphing capabilities.
The techniques presented here enable researchers to gain insight into a wide range of chemical and biological processes via spectrophotometric data. Excel is a powerful and essential tool for any analytical chemist, whether for calculating the concentration of a drug, making standard curves, or plotting the connection between absorbance and concentration. You may use Excel to gain useful insights from your experimental data by following these instructions.
Hello, my name is Rishabh Kumar and I am the author of TheTechGlance.com. I am fond of writing and I have done engineering from NIT Hamirpur due to which I have good knowledge of technology, AI, Crypto and network.