The Lineweaver Burk Plot, also referred to as a Double Reciprocal Plot, is the output of the energy kinetics Lineweaver Burk Equation in the field of biochemistry. Users may therefore be unsure of how to Making Lineweaver-Burk Plots in Excel.You’ve found the right spot if you’re looking for an easy way to make a Lineweaver Burk plot in Excel. This tutorial will walk you through Making Lineweaver-Burk Plots in Excel so you can quickly see the connection between two sets of variables.
We’ll also go over some of the main characteristics of a Lineweaver Burk plot and discuss why this kind of plot is so helpful. You’ll get everything you need by the end of the article to create an Excel Lineweaver Burk plot and make the most of your data. then let’s get going!
Step by Step Guide to Making Lineweaver-Burk Plots in Excel
What is a Lineweaver-Burk plot?
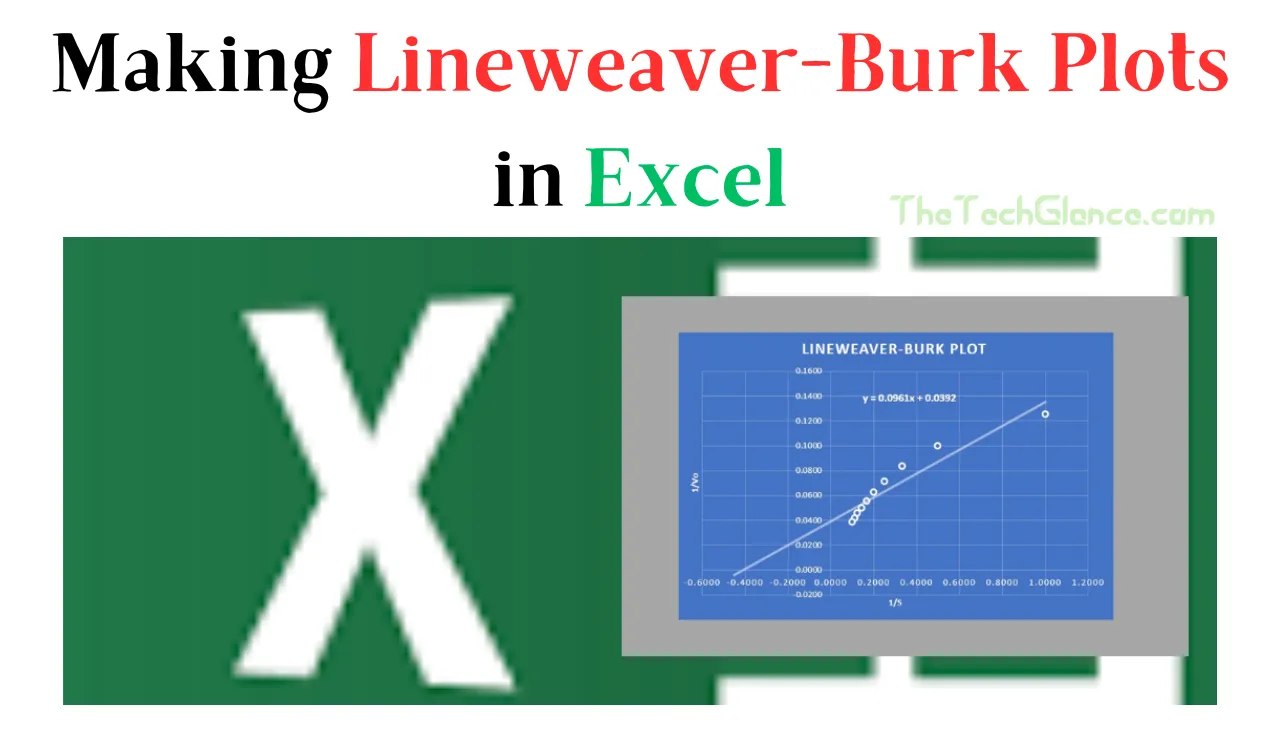
An illustration of the Michaelis-Menten equation for enzyme kinetics is called a Lineweaver-Burk plot. The reaction velocity (V) versus the reciprocal of the substrate concentration ([S]) are plotted in a double reciprocal graph. The plot is a straight line with an x-intercept of -1/Km and a slope of Km/Vmax. 1/Vmax is the y-intercept value.
Determine the kinetic parameters of enzymes, such as Vmax and Km, using the Lineweaver-Burk plot. Additionally, it can be utilized to differentiate between various kinds of enzyme inhibition.
Excel Setup for Lineweaver-Burk Plots
Step by Step Excel Setup for Lineweaver-Burk Plots:
- Setting up the data correctly is the first step in making a Lineweaver-Burk display in Excel.
- Two columns should be used to organize the data in a table: the first column should hold the substrate concentrations, and the second should contain the reaction rates.
- Select the data once it has been properly formatted, and then click the “Insert” tab on the ribbon.
- Select the first scatter plot from the drop-down menu by selecting the “Scatter” button in the Charts section. The data will then be plotted as a scatter plot.
Calculations in Excel
These calculations are often used to determine the kinetic parameters of an enzyme-catalyzed reaction, such as the Michaelis-Menten constant (Km) and the maximum velocity (Vmax).
Step-by-step instructions on calculating the inverse of substrate concentration [1/[S]] and initial velocity [1/V0]:-
Step 1: Compile the required information.
You will require experimental data from an enzyme-catalyzed reaction in which the beginning velocity (V0) was recorded at various substrate concentrations ([S]). A variety of substrate concentrations should ideally be represented in your data, so make sure to do this.
Step 2: Arrange the information
Make a table with two columns: one for the initial velocity (V0) and one for the substrate concentration ([S]). Make that the substrate concentrations and velocities are expressed in the same units (for example, Molar and M/s).
Step 3: Inversely transform substrate concentrations ([1/[S]]).
Calculate the inverse of the concentration by taking the reciprocal (1/[S]) for each substrate concentration value ([S]) in your table.
Step 4: Convert initial velocities to the inverse ([1/V0])
Calculate the inverse of the velocity by getting the reciprocal (1/V0) for each beginning velocity (V0) value in your table.
Step 5: Visualize the data
Make a scatter plot with the beginning velocity ([1/V0]) and the inverse of substrate concentration ([1/[S]]) on the x- and y-axes, respectively. A data pair from your table is represented by each point on the plot.
Step 6: Analyze the plot
The plot should show a straight line for enzyme-catalyzed reactions that follow Michaelis-Menten kinetics. This line’s equation is as follows:
y = (Km/Vmax) * x + (1/Vmax)Where:
- y is the inverse of initial velocity ([1/V0])
- x is the inverse of substrate concentration ([1/[S]])
- Km is the Michaelis-Menten constant
- Vmax is the maximum velocity of the reaction
Step 7: Determine Km and Vmax
You can determine Km and Vmax by calculating the slope and intercept of the line you produced in Step 6. You may find the value of Km from the line’s slope (Km/Vmax) and the value of Vmax from the line’s y-intercept (1/Vmax).
Step 8: Finalize the results
Now that you have calculated Km and Vmax, report these values as the kinetic parameters of the enzyme-catalyzed reaction.
NOTE:- Remember that the validity of the assumptions made for the kinetic model used—in this example, Michaelis-Menten kinetics—as well as the quality of the experimental data determine the correctness and dependability of your results. Alternative kinetic models may need to be taken into account if your data does not fit a straight line on the plot and instead indicates departures from straightforward Michaelis-Menten kinetics.
How to Making Lineweaver-Burk Plots in Excel
You’ll need the following information to make a Lineweaver-Burk plot:
The rate of the reaction (V) at various substrate concentrations ([S]). Following these steps will allow you to construct the plot after you have the data:
- Plot 1/[S] and 1/[V] on the x and y axes, respectively.
- A straight line should be drawn through the data points.
- Km/Vmax is the line’s slope.
- The line’s x-intercept is -1/Km.
- The line’s y-intercept is equal to 1/Vmax.
Lineweaver-Burk plot advantages
Comparing Lineweaver-Burk plots to other enzyme kinetic plots, like the Michaelis-Menten plot, reveals significant advantages. These benefits consist of:
- They are simpler to visually assess.
- They can be used to more precisely calculate the kinetic parameters of enzymes.
- They are useful for differentiating between various kinds of enzyme inhibition.
Disadvantages of Lineweaver-Burk plots
Additionally, there are some drawbacks to Lineweaver-Burk plots, such as:
- Compared to other forms of enzyme kinetic plots, they are less sensitive to variations in Vmax.
- Experimental flaws in the measurement of V and [S] may have an impact on them.
Troubleshooting Common Issues
If the data does not follow a linear trendline, the Michaelis-Menten equation may not be being followed by the enzyme or the data may not be in the proper format. Before attempting to generate a Lineweaver-Burk plot in this situation, it is preferable to verify the data and ensure that it is in the proper format.
It is possible that the data is not exact enough if it fits a linear trendline yet the estimated values are inaccurate. In this situation, it is best to get more accurate data before retrying.
Read More : 5 Proven Methods for Fixing Black Spots on HP Laptop Screens
Clear PowerShell Previous command history
Conclusion
For those studying or researching enzyme kinetics, learning how to Making Lineweaver-Burk plot in Excel is a valuable skill. You now possess the skills necessary to create this potent graph, which can help you determine important variables like Km and Vmax. Excel is a great tool for doing enzymatic analysis without the requirement for specialized software because of its usability and accessibility.
This blog post explains how to Making Lineweaver-Burk Plots in Excel step-by-step. We hope that this article provides you with enough information about creating a Lineweaver Burk layout to allow you to do so.
Hello, my name is Rishabh Kumar and I am the author of TheTechGlance.com. I am fond of writing and I have done engineering from NIT Hamirpur due to which I have good knowledge of technology, AI, Crypto and network.